

Gold finally exhaled.
After sprinting to record highs, it posted its sharpest drop in years this week as traders took profits and reset their positions. But big moves like that don’t kill a bull market; they clear the deck.
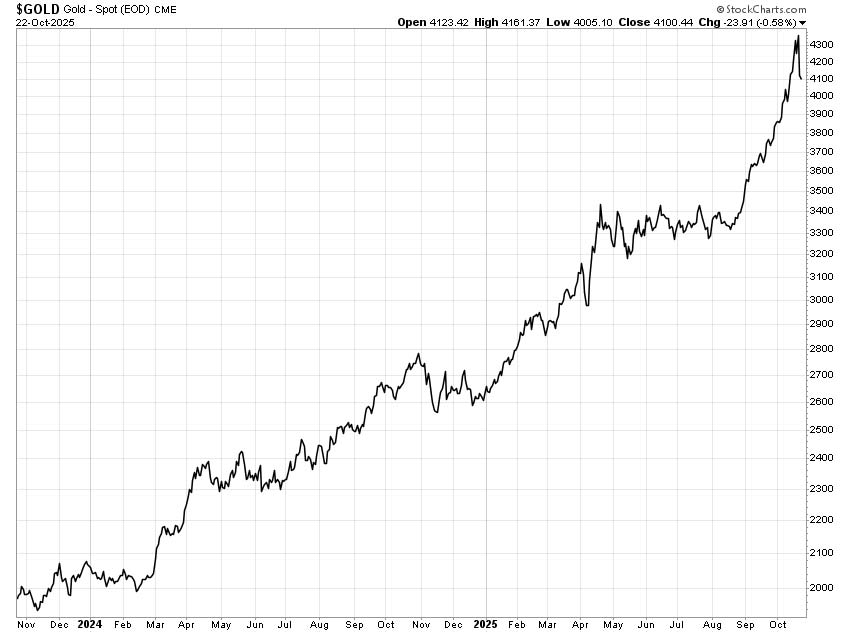
If the longer-term drivers – central bank buying, deficit worries, and a firm dollar trend that can turn – stay in place, the metal still has room. Pullbacks are simply the toll you pay on the highway.
That sets the stage for Barrick Mining (NYSE: B).
Barrick is a diversified operator, not a one-mine bet. It runs Tier One gold assets in Nevada, the Dominican Republic, Tanzania, and Congo, plus a growing copper arm in Zambia and a huge copper-gold project in Pakistan.
The company’s playbook is simple: Keep a strong balance sheet, push costs down, and fund the next wave of growth from internal cash rather than debt or dilutive deals.
Its latest numbers back that up. In the second quarter of 2025, revenue was $3.7 billion. Net earnings were $811 million, or $0.47 per share, with adjusted EPS also $0.47. Attributable EBITDA (earnings before interest, taxes, depreciation, and amortization) hit $1.69 billion with a 55% margin.
Free cash flow was $395 million even as Barrick stepped up spending at Lumwana (the copper mine in Zambia) and Reko Diq (the copper-gold project in Pakistan). The company ended the quarter with $4.8 billion in cash and a small net-cash position of $73 million. Shareholders got a $0.15 quarterly dividend – including a $0.05 enhancement tied to net cash – and $268 million of buybacks during the quarter.
Operations are trending the right way. Gold production rose 5% quarter over quarter. Production at Nevada Gold Mines increased 11% from the first quarter on better grades and throughput, while output jumped 28% in the Dominican Republic as plant upgrades took hold. Copper production climbed 34% as Lumwana improved mining rates and unit costs fell.
Now to the Value Meter breakdown.
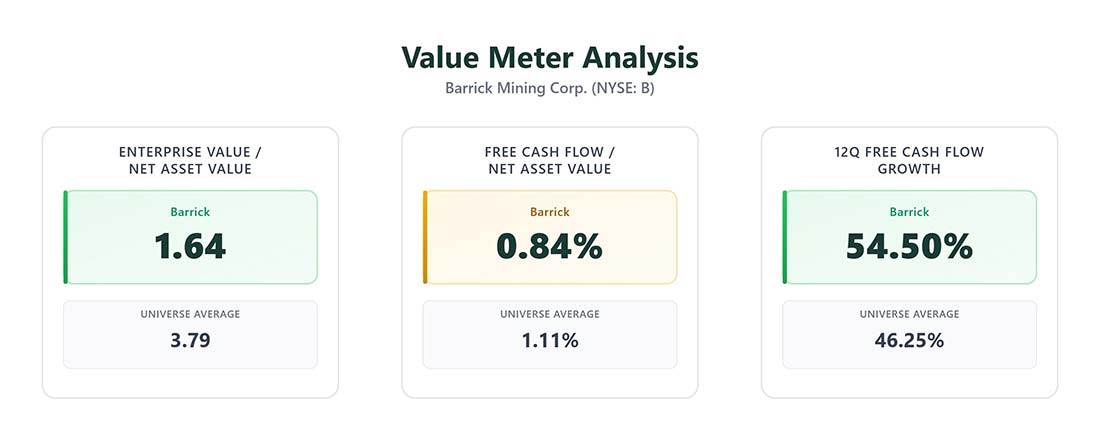
On valuation, Barrick’s average EV/NAV is 1.64, versus a universe average of 3.79. That tells us the stock is cheaper than its peers, because you pay less for each dollar of net assets.
On cash efficiency, the company’s average FCF/NAV is 0.84%, versus 1.11% for its peers. That’s a notch worse, meaning Barrick turns assets into free cash a bit less efficiently than the average company in our universe right now.
But there’s more to the story here. On momentum of the cash engine, Barrick’s 12-quarter FCF growth rate is 54.50% versus 46.25% for its peers. That’s better, suggesting cash generation is trending faster than the pack.
What about the stock?
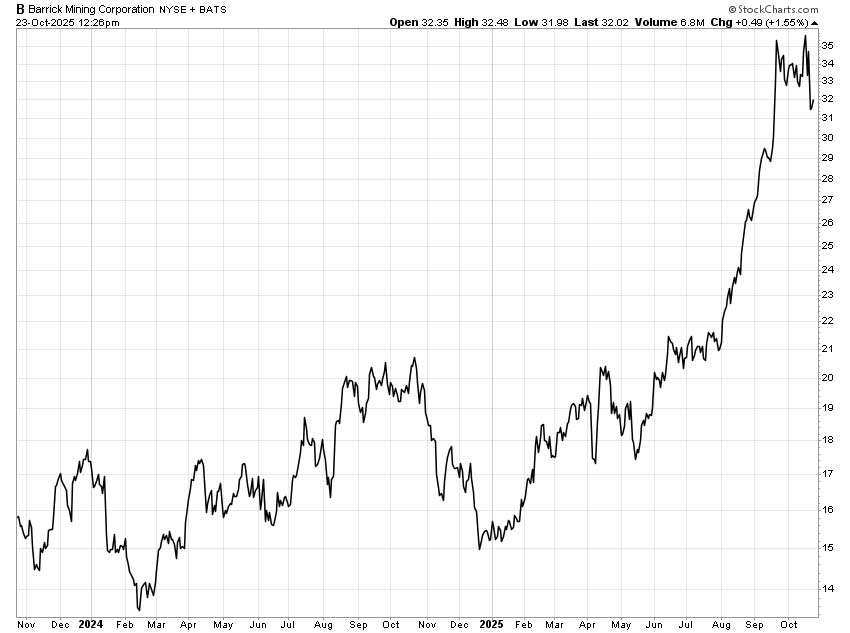
Shares have ripped from the mid-teens last winter to the low $30s now, with a brief spike toward the mid $30s as gold went vertical. (The recent dip tracks the metal’s cooldown more than any change to Barrick’s story.)
If bullion finds support and copper stays firm, Barrick’s blend of low-cost gold and expanding copper should keep free cash flow coming. The pipeline – including the ramp-up in the Dominican Republic, Reko Diq, and a “Super Pit Expansion” at Lumwana – adds real torque to 2026 through 2028 without stretching the balance sheet today.
So aside from the dip in gold prices, this is a quality operator priced below the peer pack with improving operations and a clean balance sheet. For investors who want leverage to the metal without betting the farm, Barrick still looks like the adult in the room.
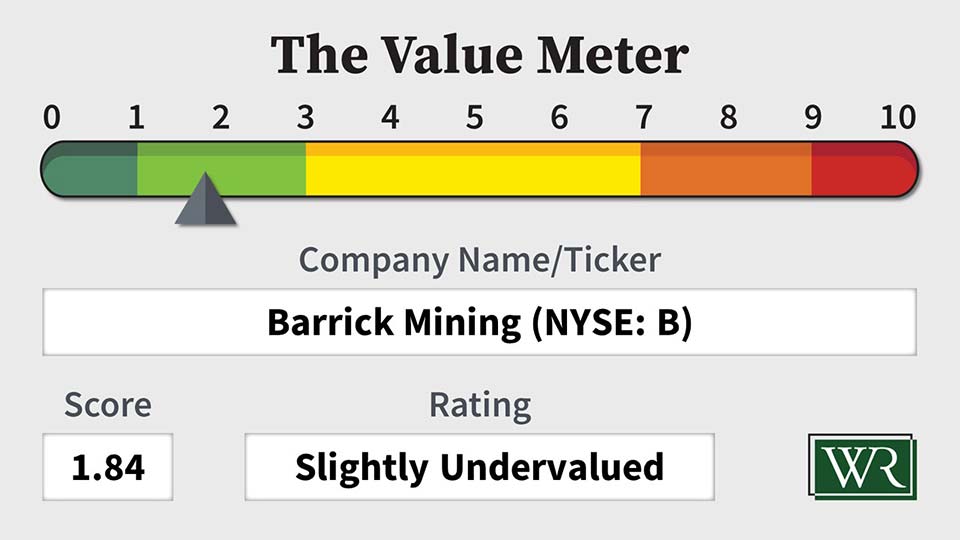
The Value Meter rates Barrick Mining as “Slightly Undervalued.”
What stock would you like me to run through The Value Meter next? Post the ticker symbol(s) in the comments section below.