

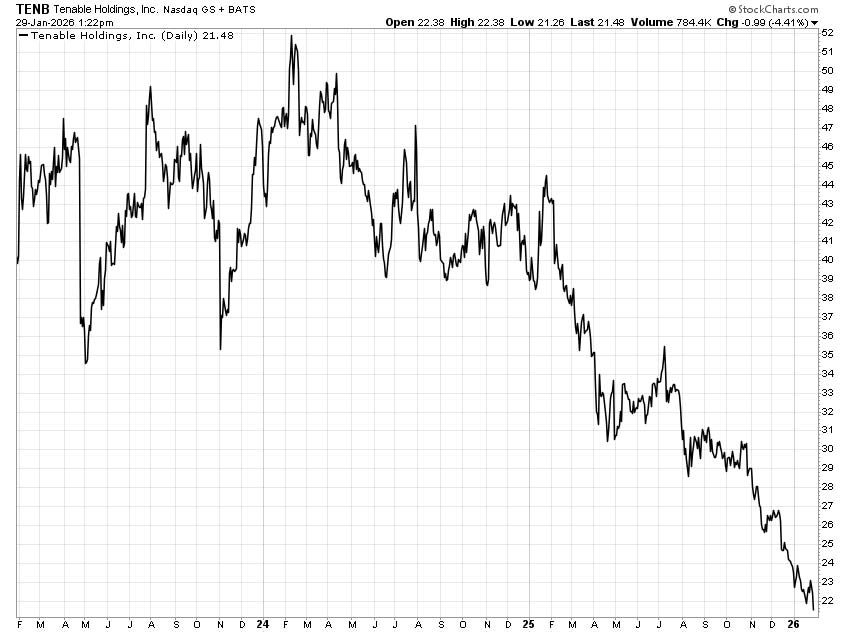
Tenable Holdings (Nasdaq: TENB) doesn’t look like a stock the market is excited about.
The share price has been stuck in a long, grinding downtrend. Sentiment toward midcap software remains fragile, and investors are still skeptical of companies that once traded on growth but are now being judged on cash.
Despite the weak price action, the underlying financial profile has continued to firm up.
In the third quarter of 2025, Tenable generated $58.5 million of unlevered free cash flow. That brought trailing 12-month unlevered free cash flow to $275 million, with margins expanding to 28.2%, up from 18.3% three years ago. (“Unlevered” simply means that the figure doesn’t include the costs of repaying debt.)
Over the same period, non-GAAP operating margins have more than doubled, reaching 23.3%, while gross margins remain above 80%. At the top line, revenue continues to grow at a low-teens pace (with 95% of it being recurring), and short-term remaining performance obligations are up 13% year over year.
In other words, while the market has been focused on slowing growth and declining valuations among software firms, Tenable has been quietly improving the quality and durability of its cash flows.
Let’s see what The Value Meter has to say, starting with valuation.
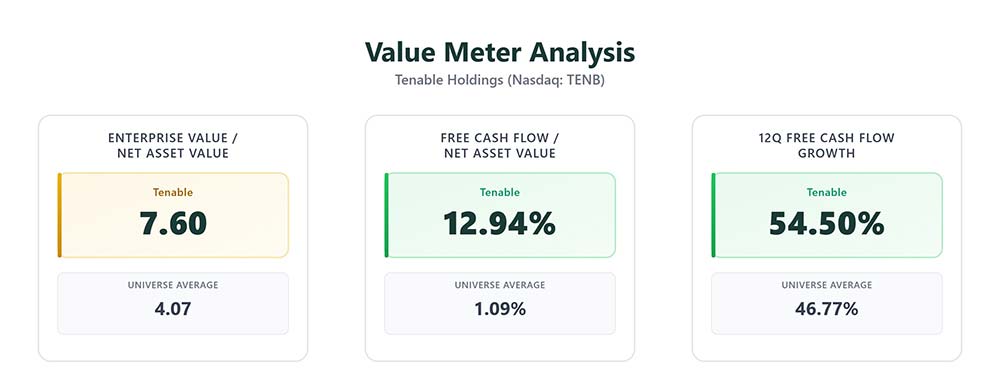
Tenable currently trades at an enterprise value-to-net asset value (EV/NAV) ratio of 7.60, compared with a universe average of 4.07. On an asset basis alone, the stock does not look cheap.
That’s an important starting point. A higher EV/NAV multiple tells us the market is still assigning a premium to Tenable’s balance sheet. To justify that premium, the company needs to demonstrate that its assets are producing meaningfully more cash than the average business.
This is where the story changes.
Over the past four quarters, Tenable’s free cash flow has averaged 12.94% of its net asset value. The universe average is just 1.09%.
That gap is substantial.
In plain terms, Tenable is extracting far more cash from its asset base than most comparable companies. This isn’t a marginal improvement. It’s a structural difference in efficiency.
The trend supports that conclusion.
Over the past 12 quarters, Tenable has grown its free cash flow quarter over quarter 54.5% of the time, modestly above the universe average of 46.8%. That suggests the cash flow improvement isn’t a one-quarter anomaly; it’s part of a broader transition toward a more mature, cash-generative operating model.
If cash flow is improving this much, why hasn’t the stock followed? The answer likely has less to do with Tenable specifically and more to do with the environment it operates in.
The market has been unforgiving toward software companies that no longer fit neatly into the “high-growth” bucket. Revenue growth has slowed across the sector. Valuation multiples have compressed. Investors are demanding proof of financial strength, not just expansion.
Tenable sits squarely in that transition zone. It’s no longer being rewarded for growth alone, but it hasn’t yet earned the steady, defensive valuation of a mature cash compounder.
That creates tension – and tension is often where mispricing starts to form.
When we weigh these factors together, the picture becomes clearer.
Tenable’s asset valuation remains elevated relative to the broader universe. That caps how undervalued the stock can appear. At the same time, its cash generation is meaningfully stronger than average, and its free cash flow trajectory continues to improve.
Those two forces offset each other.
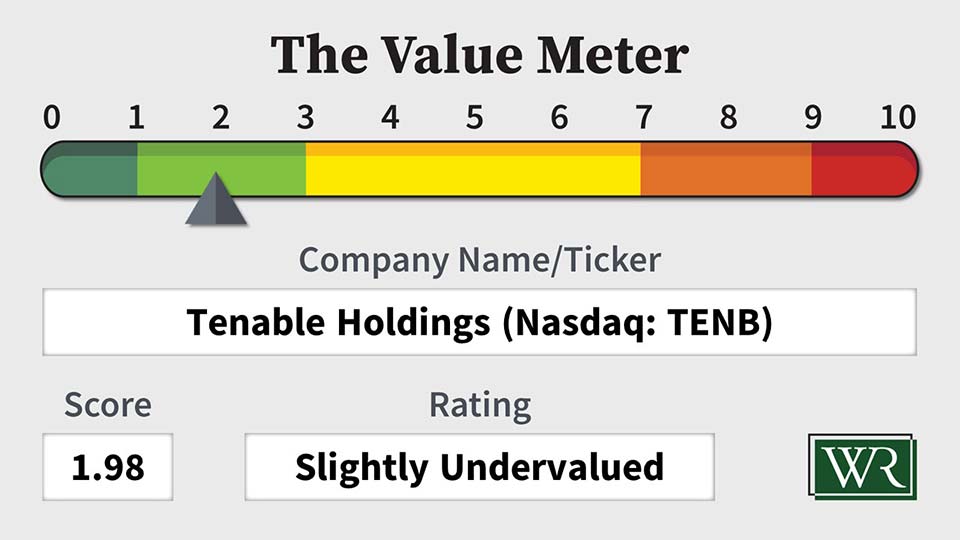
The result is a stock that isn’t a screaming bargain, but also isn’t priced as efficiently as its improving fundamentals would suggest.
That’s why The Value Meter rates Tenable as “Slightly Undervalued.”
What stock would you like me to run through The Value Meter next? Post the ticker symbol(s) in the comments section below.